BMR Calculator
Your resting calorie burn through all three standard formulas at once, so you can see how far apart they land. Includes the resting-rate figure that watches and metabolic carts report, and what each activity level turns it into.
BMR Calculator
All three are worked out below whichever you pick here.
Katch-McArdle works from lean mass, so it stays blank until you enter this.
The same body through all three formulas
| Formula | BMR | Gap |
|---|---|---|
| Mifflin-St Jeor 1990 | – | – |
| Revised Harris-Benedict 1984 | – | – |
| Katch-McArdle lean mass | – | – |
What that becomes once you move
| Activity level | Multiplier | Daily burn |
|---|---|---|
| Sedentary | 1.20 | – |
| Lightly active | 1.375 | – |
| Moderately active | 1.55 | – |
| Very active | 1.725 | – |
| Extra active | 1.90 | – |
Those columns are total daily burn, not a calorie target. The TDEE calculator builds eating targets from them.
Run the same body through two BMR calculators and you will often get two answers. A 30-year-old man at 70 kg and 175 cm comes out at 1,649 calories a day on one site and 1,696 on the next. Neither site is broken. They are running different equations, fitted on different groups of people in different decades. This page runs all three at once and prints the gap between them, so you can see the disagreement rather than guessing which tab to trust.
Three formulas, one body
Mifflin-St Jeor is the default here. Published in 1990 in the American Journal of Clinical Nutrition, it reads weight, height, age and sex: 10 times kilograms, plus 6.25 times centimetres, minus 5 times age, then plus 5 for men or minus 161 for women. For the man above that is 700 + 1,093.75 − 150 + 5, which comes to 1,649.
Harris-Benedict came first, in 1919, and the version in use today is the 1984 revision by Roza and Shizgal. Same four inputs, heavier coefficients on weight and height. It returns 1,696 for the same man, 47 calories above Mifflin, and the gap widens as body weight climbs.
Katch-McArdle throws out height and age and works from lean mass instead: 370 calories, plus 21.6 for every kilogram of you that is not fat. It needs a body fat percentage, which is why that row stays blank until you enter one. At 20 percent body fat our man carries 56 kg of lean mass, so Katch-McArdle gives 370 + 1,209.6, or 1,580. That is 69 below Mifflin and 116 below Harris-Benedict, and all three describe the same person.
Which number to use
Mifflin-St Jeor, unless you have a body fat reading you believe. The American Dietetic Association reviewed the validation literature in 2005 and found it landed within 10 percent of measured resting expenditure more often than the alternatives, in lean and obese adults alike. That result is why it became the default on most calculators built since, including this one.
Katch-McArdle overtakes it once lean mass is known, because it is the only one of the three that can separate a 90 kg lifter from a 90 kg desk worker of the same height and age. The two height-and-weight formulas hand those two people an identical figure, and their measured resting burns can sit 200 calories apart. The catch is the input. A body fat percentage from a bathroom scale or a hurried caliper pinch carries its own error, and a bad percentage in a good formula beats Mifflin at nothing. The body fat calculator runs the Navy tape method, which is cheap, repeatable and good to about three points either way.
BMR, RMR, and the figure on your watch
A true basal measurement comes with conditions attached: 12 hours fasted, lying still, thermally neutral room, measured on waking before you have moved. Almost nobody has had one taken. What a metabolic cart records in practice, and what your watch reports as resting calories, is resting metabolic rate, which runs about 10 percent higher because you are awake, upright and digesting breakfast. The panel prints both, so the figure here lines up with the figure you were given somewhere else instead of looking 150 calories wrong.
What the resting number is for
It is the floor under everything else you burn, 60 to 70 percent of the daily total for most adults. Multiply it by an activity factor and you have total daily energy expenditure, which is where eating targets come from: the TDEE calculator takes it from there and builds the deficit and surplus columns, while the difference between BMR and TDEE explains which of the two any given recommendation is talking about. The table lower down this page applies the same five activity multipliers to your resting figure and stops at total burn, with no diet targets attached.
Two warnings. A high BMR is not a fast metabolism, because a tall heavy person computes higher than a short light one and that is arithmetic rather than a verdict on either of them. And the basal figure makes a poor calorie target: weeks spent eating at it cost lean mass and leave protein and micronutrients short, which the guide to deficit size works through in detail.
Where this stops
Every equation here is a population average with individual spread around it. Within 10 percent at 1,650 calories is a window 330 wide, and thyroid disease, medication, pregnancy and a long dieting history all move the real figure in ways no formula reads. Age moves it less than most people assume: Pontzer and colleagues measured 6,421 people in 2021 and found resting burn, adjusted for body composition, holding steady from 20 to 60. Treat the output as a starting point, then correct it against two weeks of your own weight data.
Scope and correction note, 6 October 2026: The Mifflin-St Jeor, revised Harris-Benedict and Katch-McArdle equations are published research; the activity multipliers are calculator convention rather than measured values, and the resting rate shown here is the basal figure times 1.1. Nothing on this page is medical or dietetic advice. See the editorial policy and medical disclaimer.
Common questions
What is BMR?
The calories your body spends staying alive with no movement at all: heart, lungs, brain, kidneys, the constant replacement of cells. For most adults it is 60 to 70 percent of everything they burn in a day, which makes it the biggest line in the budget and the one that responds least to anything you do this month.
What is a normal BMR?
A 30-year-old man at 70 kg and 175 cm comes out near 1,650 kcal. A woman of the same age, height and weight comes out near 1,480, because Mifflin-St Jeor subtracts 161 where it adds 5 for men. Most adults land between 1,200 and 2,000. Size and muscle drive the figure, so a tall heavy person having a higher BMR than a short light one tells you nothing about either metabolism.
Why do two BMR calculators give different answers?
Because they are running different equations on the same body. For that 30-year-old man at 70 kg and 175 cm, Mifflin-St Jeor returns 1,649 kcal and the revised Harris-Benedict returns 1,696, a gap of 47. Add a 20 percent body fat reading and Katch-McArdle returns 1,580, which puts the three 116 kcal apart. The table on this page runs all three at once so you can see the spread instead of wondering which site was lying.
Which BMR formula is the most accurate?
Mifflin-St Jeor, until you have a body fat measurement you believe. The American Dietetic Association reviewed the validation literature in 2005 and found it predicted measured resting expenditure more closely than Harris-Benedict in both lean and obese adults. Katch-McArdle overtakes it once lean mass is known, because it is the only one of the three that can tell a 90 kg lifter apart from a 90 kg desk worker of the same height.
What is the difference between BMR and RMR?
A basal measurement is taken after a 12-hour fast, lying still in a thermally neutral room, straight out of sleep. Hardly anyone has ever had one taken. A metabolic cart in a clinic, or the resting figure on your watch, reports resting rate, which runs about 10 percent higher because you are awake, upright and digesting something. This page prints both, so the number here can be compared against the number you were given.
Should you eat below your BMR?
There is rarely a reason to. Daily burn is BMR times an activity multiplier, and the lowest band is 1.2, so a sedentary person with a 1,650 kcal BMR burns about 1,980 and can take a 20 percent cut while still eating 1,584. Weeks spent under the basal figure cost lean mass, flatten training and make protein and micronutrient targets hard to reach. When the arithmetic only balances below it, add activity rather than remove more food.
Can you raise your BMR?
A little, and slowly. Muscle burns roughly 13 kcal per kg per day at rest against about 4.5 for fat, so 5 kg of new muscle buys something like 40 kcal a day. Worth having over years, and far less than the supplement aisle implies. The lever with real leverage on daily burn is how much you move, which is the activity table lower down this page.
Does BMR drop with age?
The formula says yes: Mifflin-St Jeor removes 5 kcal for every year, so the same body computes 100 kcal lower at 50 than at 30. Pontzer and colleagues measured 6,400 people in 2021 and found basal rate holds roughly flat from 20 to 60 once body composition is accounted for. Most of what people call an age-related slowdown is lost muscle and fewer steps, both of which are addressable.
The other calculators
They all run together on the health and fitness calculator hub.
Read the reasoning
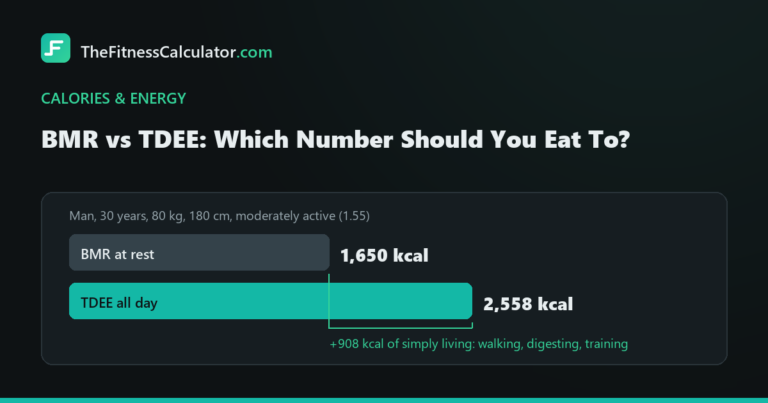 BMR vs TDEE: Which Number Should You Actually Eat To?Understand estimated resting energy, daily expenditure and calorie scenarios without treating BMR as a personal minimum intake.
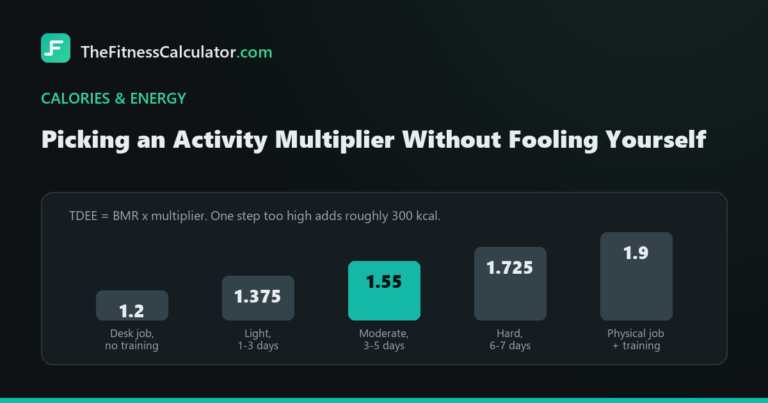 Picking an Activity Multiplier Without Fooling YourselfSee how activity multipliers change TDEE, why step counts are only context, and how to avoid counting exercise twice.
 How Big Should a Calorie Deficit Be?Compare calorie-deficit examples and learn why fixed calorie rules cannot promise a weekly weight-loss result.