Why Your Calorie Count Is Wrong, and by How Much
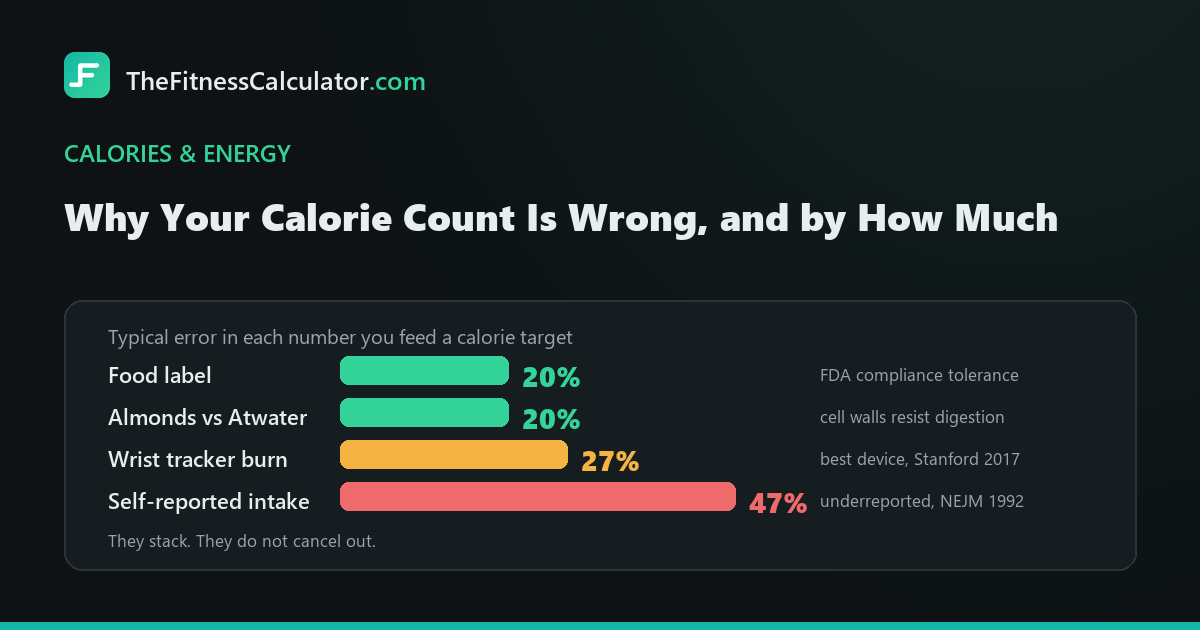
Every calorie figure you use has an error bar. The label on the packet, the entry in the app, the number on your watch and the estimate from any TDEE equation are all approximations, and they do not cancel each other out. They stack.
The label is allowed to be wrong
Nutrition labels are compliance documents, not measurements. In the United States the FDA treats a product as compliant if the measured calories are no more than 20% above the declared value. The European Union allows similar tolerances. A 200 calorie bar can hold 240 and still be legal.
Nobody is cheating. The tolerance is written into the rule.
The energy conversion factors underneath the labels are approximations too. Atwater’s system, which assigns 4 calories per gram of protein and carbohydrate and 9 per gram of fat, dates from around 1900 and ignores how much energy the food actually gives up during digestion. A 2012 trial in the American Journal of Clinical Nutrition measured this directly and found almonds deliver about 20% fewer calories than the Atwater factors predict, because the cell walls resist digestion. Whole foods with intact structure tend to overstate. Processed foods tend to be closer to the label.
Restaurant food is worse
A multisite randomised study published in the Journal of the Academy of Nutrition and Dietetics bomb-calorimetered 364 restaurant meals and compared them against the stated values. The average meal came in 6% above what the menu claimed, but the spread was enormous, with individual dishes running hundreds of calories over. A 2018 BMJ study extended this across five countries and found most main meals exceeded a third of a typical adult’s daily energy needs on their own.
The largest error is the person holding the pen
The classic demonstration is a 1992 study in the New England Journal of Medicine on people who described themselves as diet resistant. Under doubly labelled water measurement, they underreported their intake by 47% and overreported their exercise by 51%. These were not liars. They were ordinary people misjudging portions, forgetting the oil in the pan and skipping the handful of something on the way past the kitchen.
Assume you are doing some version of the same thing, because almost everyone is.
Cooking oil is the single most common blind spot. A tablespoon of olive oil is about 120 calories, and pans usually take two or three. Do that twice a day and you have 500 unlogged calories, which is the entire deficit most people are trying to run.
Your watch is guessing too
Stanford tested seven wrist worn trackers in 2017 against clinical measurement. Heart rate was good, with median error under 5%. Energy expenditure was not: no device managed a median error below 27%, and the worst reached 93%. A watch reporting 600 calories burned on a run may mean anything from 430 to 1,150.
Worse, most fitness apps then add that number back to your daily allowance, so a single overestimate lands twice: once by inflating the burn, and once by licensing the food. Eat to your calculated target and treat exercise as the thing that raises the target over weeks, not as a per-session credit. That distinction is the whole point of picking an activity multiplier properly.
What to do with numbers this soft
The trick is to stop chasing accuracy and start chasing consistency. A tracking method that is wrong by the same 15% every day still shows you exactly what happens when you change something, and change is the only thing you can act on.
- Weigh food rather than eyeballing it. Volume estimates for calorie dense foods are off by a factor that matters. Cheese, nuts, oil and peanut butter are the usual offenders.
- Log the same entries every time. Crowdsourced app databases contain wildly different figures for the same food. Pick one entry and stick with it.
- Count the cooking fat. It is invisible on the plate and it is not small.
- Ignore the calories your watch says you burned. Use it for heart rate, steps and consistency instead.
- Judge the plan on the trend, not the total. Two weeks of a flat seven day average means your real intake matches your real expenditure, whatever the app says.
This is why the output of any calculator is a starting hypothesis. Run the number from the calorie and TDEE calculator for a fortnight, watch what the scale trend does, and adjust from there. When the trend stops moving, work through why weight loss stalls before assuming your metabolism is at fault. Tracking drift is the more common answer, and it is fixable in a week. The other calculator guides cover the numbers you would adjust next.