What BMI Actually Measures, and Where It Falls Apart
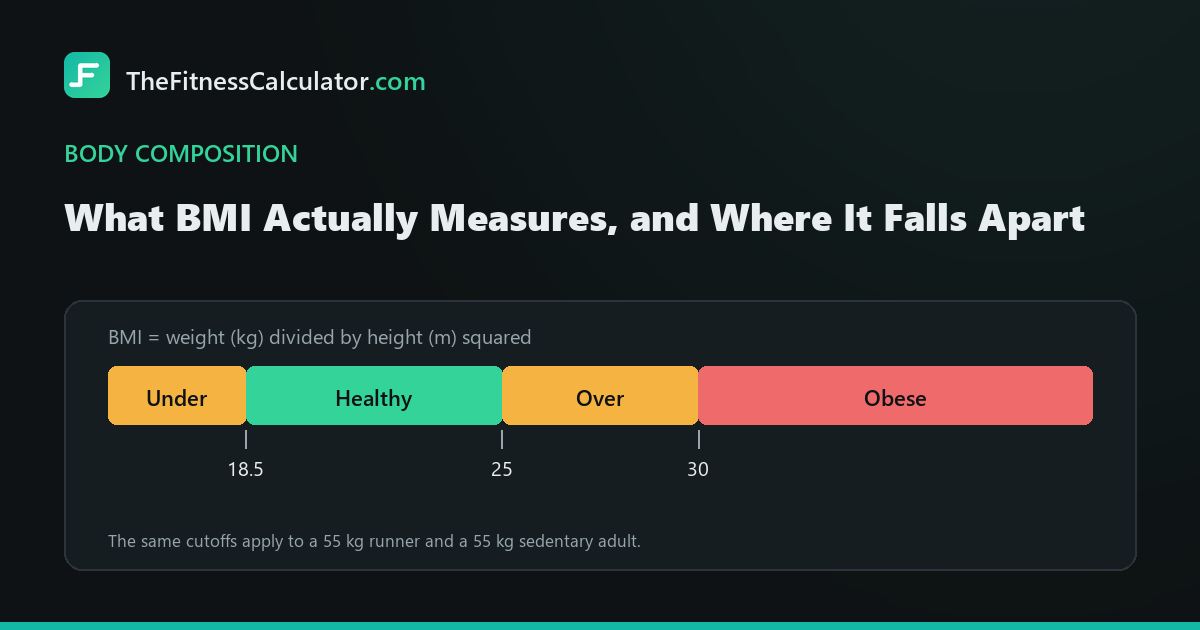
BMI is your weight in kilograms divided by your height in metres squared. That is the whole formula. Someone who weighs 80 kg and stands 1.80 m tall has a BMI of 80 ÷ (1.80 × 1.80), which comes to 24.7.
Adolphe Quetelet worked the ratio out in the 1830s. He was a Belgian astronomer and statistician mapping how body sizes spread across a population, and he wanted a figure that stayed roughly stable as people got taller. He said plainly that it described groups rather than individuals. Life insurers picked it up in the mid-twentieth century to price policies, Ancel Keys renamed it the Body Mass Index in a 1972 paper, and it survived because it costs nothing and takes two seconds.
Almost every complaint people have about BMI traces back to that history. It is a population statistic doing a job it was never designed for.
The categories, and the range hiding behind them
- Below 18.5: underweight
- 18.5 to 24.9: healthy weight
- 25.0 to 29.9: overweight
- 30.0 and above: obese
The single score gets all the attention, but the healthy weight range is the more useful output. At 1.80 m, a BMI between 18.5 and 24.9 covers everything from 59.9 kg to 80.7 kg. That is a spread of nearly 21 kg, and two people sitting at opposite ends of it look nothing like each other. The BMI calculator on the home page prints that range next to your score for exactly this reason.
Muscle breaks it
Muscle is about 15% denser than fat, so a lean, heavily trained body weighs more than the formula expects. A rugby prop at 1.83 m and 100 kg scores 29.9, one decimal place from the obese category, while carrying perhaps 12% body fat. Sprinters, rowers and most powerlifters land in the same trap.
This is the failure everyone knows about, and it gets overstated. If you have never trained seriously with weights, you almost certainly do not carry enough muscle for it to matter. The honest test is whether a tape measure agrees with the scale, which is what the Navy tape method for estimating body fat is for.
Thin people break it too, and that is the dangerous one
Adults lose roughly 3 to 8% of their muscle mass per decade after thirty, and the loss accelerates after sixty. Someone who weighs the same at 65 as they did at 30 has usually swapped several kilos of muscle for several kilos of fat. Their BMI has not moved. Their metabolic risk has.
Researchers call this normal weight obesity, and it is common enough that a healthy BMI reading alone should not reassure anyone with a large waist. Waist circumference catches what BMI misses here: above 94 cm for men or 80 cm for women, risk climbs regardless of what the scale says.
The cutoffs are not universal
The 25 and 30 thresholds came from data on European and North American populations. The World Health Organization reviewed this in 2004 and recommended lower public health action points for many Asian populations, with 23 as the overweight trigger and 27.5 for obesity, because type 2 diabetes and cardiovascular risk climb at lower BMI values in South and East Asian groups. If your ancestry falls in that group, subtract roughly two points from where you think the danger line sits.
It says nothing about where fat sits
Fat around the organs behaves very differently from fat under the skin on your hips and thighs. Two people can post an identical BMI of 28 with completely different risk profiles depending on distribution. BMI cannot see this. A tape measure around the navel can.
So what is it good for
Screening, and tracking yourself over time. If your BMI moved from 23 to 28 over six years without a deliberate training programme, that is real information and worth acting on. If it sits at 26 while your waist is 84 cm and you deadlift three times a week, the number is noise.
Use it as one input among several. Pair it with a waist measurement, and if you want a target rather than a category, the ideal weight formulas and why they disagree covers what a sensible goal weight looks like. And before you read too much into a single morning’s reading, know that day-to-day scale weight swings by a kilo or two for reasons that have nothing to do with fat.